Learning how to navigate in the Digital Atlas of Belgium
Here is a video that shows in a few minutes how to use the main functions of the Digital Atlas of Belgium. This video explores the Indicators workspace and shows how to:
- choose indicators and map them,
- choose a geographic level,
- select a geographic unit,
- act on a geographical selection,
- display layers in the background,
- use the different restitution modes,
- print or save a favorite.
It illustrates the ability of a Géoclip observatory to make statistical data meaningful through thematic mapping. The Indicators workspace brings together more than 600 indicators, organised into 5 topics: political geography, landscape, rural world and agriculture, habitat, economic activities, population. In terms of geographic levels, the atlas offers the classic administrative divisions: municipalities, districts, provinces, regions. The atlas also includes electoral divisions, to show the results of the various elections. It also allows to map some population indicators on the population census mapping divisions: nearly 6500 sections and 20 000 sectors. This makes it possible, for example, to obtain a very detailed map of population density.
Combining two modes of cartographic representation
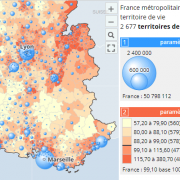
Among the examples presented in this video, one deals with agricultural data: cultivated agricultural surfaces and proportions in total agricultural areas, for potato and oilseed crops. In accordance with the rules of cartographic semiology, the proportion in the total agricultural area is represented by a choropleth map, since it is a percentage and therefore a relative size. As the cultivated surface is an additive quantity, it is represented by a map in proportional rounds. In the Digital Atlas of Belgium, these indicator pairs, cultivated surface + proportion in the total area, are represented in a combined mode: the rounds representing the surfaces are coloured according to the value ranges of the proportion.
All this is not very easy to explain in literary terms. It is much easier to understand what is a combined representation with coloured rounds and the difference with superimposed representations, by watching the video.

